Showing posts with label Dynamo. Show all posts

March 01, 2022

Dynamo: Pin All Revit Links

I have been setting up projects that have a larger than usual number of Revit links in them, and to save myself the bother of having to remember to pin each one after placement (and the bigger bother of repeatedly checking to make sure I did not miss one), I created a graph to pin all of the Revit links in the current model. The graph is rather simple, if you have the Orchid package installed and can use the Element.Pin node contained therein. I was using Revit 2020; those using other Revit versions will likely need a different version of the Orchid package.


This runs nicely in Dynamo Player. No need to select the Edit Inputs tool, as there are no inputs to edit.

November 25, 2020

Revit: Extracting Level Names in Dynamo

A few weeks back, I had a request to be able to filter a Door Schedule by the Level to which the Doors in the project were associated. That is a choice if you are only scheduling Doors in the current model, but is not an option if your Schedule includes Doors in linked models. I suggested that a Dyanmo graph could be created that would read the Level of each Door and write the Level name to a separate parameter, which could then be used for filtering. The graph would need to be run in each of the models, and, if there are later changes that add more Doors, re-run. Pretty standard stuff for a Dynamo graph.

There is just one problem with that - the built-in Revit parameter Level does not return just the name of the Level, but instead returns what is shown in the image below.

I ran those results through the String from Object node to be certain the values were seen as strings. (I suppose I should try it without that node to see if it is really necessary, but I have not done so yet.) It may be possible to extract the level name for each item on the list using a series of nodes, or perhaps some code in a code block, but the amateur programmer in me wanted to work out how to do so in Python, and it turned out be be quite simple, using string slicing. The start index of the Level name is one more than the index of the equals sign ("=") and the end index of the slice is the index of the comma. A simple for loop processes each item in the list and appends it to the result list. The image below shows the code.

July 10, 2020

Dynamo: Building User Options into a Graph

The goal of the graph on which I was working when I needed to know how to add Shared Parameters to the Other Parameter Group was to allow a user to easily add additional shared parameters that we use to track issued Sheets in our Drawing List Schedule. Our template files have the first ten of these in them, and for some projects, that is enough. Others have many more than ten issuances, particularly those that track issuances during the design phases. We have twenty additional Shared Parameters in our Shared Parameter file; adding more than one of them is tedious, at best.

Using the Parameter.AddSharedParameter node from Erik Falck Jørgensen's Orchid package makes it easy to bulk-add Shared Parameters in a Dynamo graph. For this particular task, however, I wanted to be able to offer the end user the choice of adding the second group of ten parameters, the third group of ten parameters or both the second and third groups of ten parameters, without creating separate graphs for each group of ten additional parameters, and without the user having to go into the graph and make adjustments. My solution was to use a Python Script node to handle the user options. Two separate lists of the Shared Parameter names are created, and two Boolean nodes with Is Inupt set allow the user to choose to include one or both of those lists when the graph is run. The Python Script node has four inputs; two for the lists (IN[0] and IN[2]) and two for the Boolean nodes (IN[1] and IN[3]). The image below shows the simple Python code that gathers the input values and then tests the Boolean values, adding the associated list of Shared Parameter names to the output list if the Boolean is set to True.

In Dynamo Player, when the user finds the graph file and selects the Edit Inputs tool, this is what she or he sees:
Both Booleans are intially set to False. Should the user run the graph with both set to False, the Parameter List result will display the string to which the listOut variable is set if the list is empty: "Select at least one set of Parameters to add. " The user only needs to click on the "switch" displayed for each "Add Issues" Boolean to toggle it to True.

The switch turns green when set to True. Once the desired list(s) are set to True, selecting the Play tool will run the graph and the selected Shared Parameters will be added to the active project. The Parameter List result will display a list of the names of the Shared Parameters that were added.

As always, you can select an image to see it full size.

July 02, 2020

Dynamo: Other Parameter Group

Long time, no post. If anyone is still reading this blog, I hope you and your families are doing well in these trying times. A combination of being busy with work (remotely) and not having anything about which to write caused this rather long gap between posts.

I came across something today that I wanted to document for future reference. I was working on a Dynamo graph to automate the adding of specific shared parameters as project parameters in a Revit project file, using the Parameter.AddSharedParameter node from Erik Falck Jørgensen's Orchid package.

One of the required inputs is the Group under which the parameter will be organized. The particular parameters with which I was dealing are a continuation of ten that we already have in our project template files, and they are located under the "Other" group. The Select BuiltIn Parameter Group node that ships with Dynamo is used to generate the needed value, but PG_OTHER is not on the list from which you select. The first item on the list, INVALID, might not seem like something you would want to select, but in this case, that is the correct choice, to have the parameters created placed under the Other category.

October 29, 2019

Dynamo: String Concatenation 2

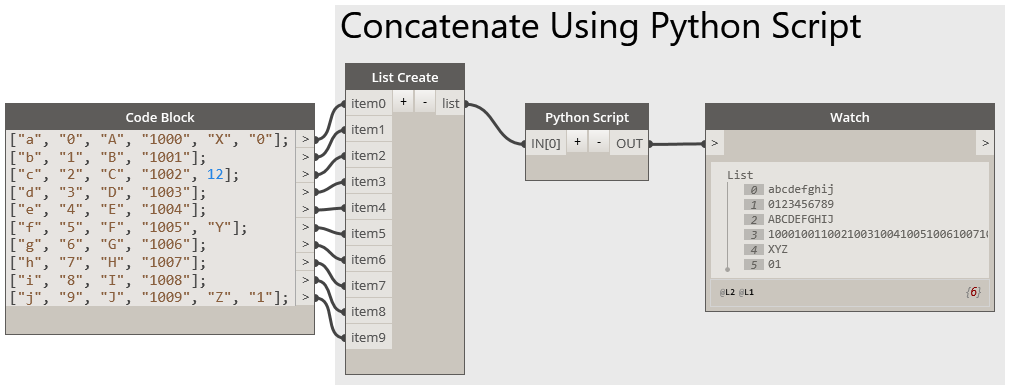
I had some time and tested some scenarios using the "successful" nodes for concatenating a list of strings shown in this previous post and noticed that the concatenation will still work if the lists do not all have the same numbers of strings. It still concatenates the first item in each list, and so on; once the shortest list runs out of items, it simply does not contribute anything to subsequent concatenations. The process will fail, if the items in the source lists contain anything other than strings, however. That is not a particular surprise (to me, anyway), but a combination of being able to handle non-text items in the source lists without throwing an error/crashing the graph and wanting to see just what it would take to write a Python Script node that could process a variable number of lists of strings prompted me to try it.

A List Create node is still necessary to make a single list of lists to serve as the input, so that the Python Script node need only have one input, but the List.Transpose and List.Flatten nodes can be eliminated.


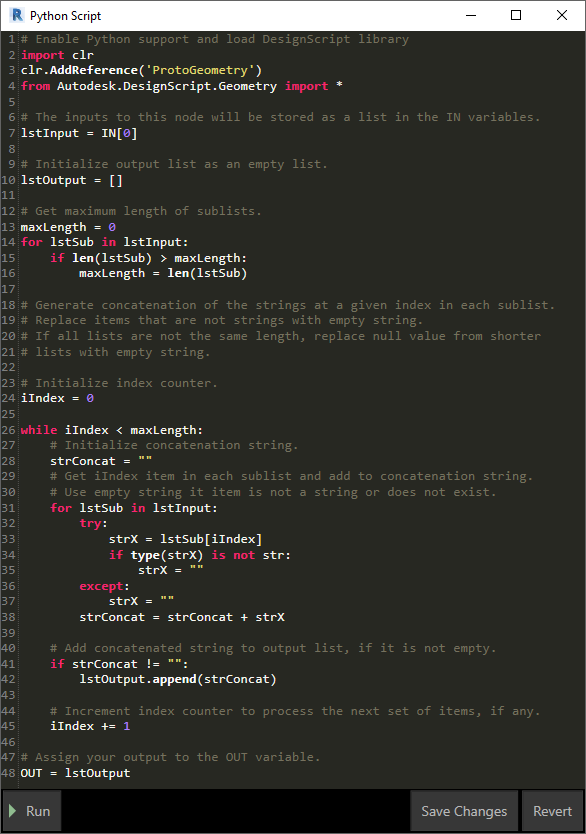
The Python code is fairly straightforward.
  • The input list of strings is assigned to lstInput, and lstOutput is set up as an empty list, to receive the list of concatenated strings, which will be the output of the node.
  • A for statement examines the length of each of the sublists in lstInput, to determine the maximum list length (maxLength). This is used to set the number of times the concatenation code needs to be run: once for every item in the longest list.
  • An index counter, iIndex, is initialized to the first index, 0.
  • A while statement is used to process the lists, once for each item on the longest list.
  • On each pass through the while code, a variable to hold the concatenated string from that pass (strConcat) is initialized as an empty string.
  • Then, for each sublist in lstInput, strX is set to the string at the current index being processed. This is done in a try statement, so that the code does not fail when a shorter list has no item at the current index. If a value is returned, an if statement verifies that it is a string. If not, strX is reset to an empty string. If a value is not returned to strX, the except statement sets strX to an empty string.
  • The string value in strX is then added to the end of strConcat, and the for statement is rerun for the next sublist, until all sublists have been processed.
  • With the fully processed concatenated string in hand, an if statement checks the value, to see if it remains an empty string. If not, the string is appended to lstOutput. If it is empty, no action is taken.
  • Finally, the index counter (iIndex) is incremented, and the while statement is run again, provided that iIndex remains less than the length of the longest sublist (maxLength).
  • Once the while statement has been run once for each item in the longest list, the list of concatenated strings in lstOutput is sent to the output of the node.
It turns out that the code required to handle a variable number of lists of strings was not as complicated as I thought before I wrote it. For situations where I am certain that the lists of strings to be concatenated will in fact be lists of strings, I probably would use the out-of-the-box nodes shown in the previous article, as it is easier to read (no "magic" black box of Python code doing who knows what), but in cases where the lists might not all be lists of strings (user inputs?), I might choose to use the Python Script node rather than checking the lists of strings to verify that all items are strings.

October 25, 2019

Dynamo: String Concatenation

This may be basic and blindingly obvious to more experienced Dynamo users, but this is something with which I have struggled for some time, and now that I have finally sorted it out, I wanted to document it here for easy future reference.

The String.Concat node in Dynamo provides an easy way to combine two or more strings into one string.
When each item fed into the stringn inputs is an individual string, all of the strings are combined into one string, and that is the output of the node, as shown in the image above.

I rarely need to combine one set of individual strings, however; I almost always have lists of strings to process. Perhaps there is some deficiency in the way I think, but when I first tried to use the String.Concat node with lists of strings, I was expecting that the the result would be a list of concatenated strings, and that the value at each index in that list would be the concatenation of the strings at that same index in each of the input strings. Unfortunately, that is not what the node does.
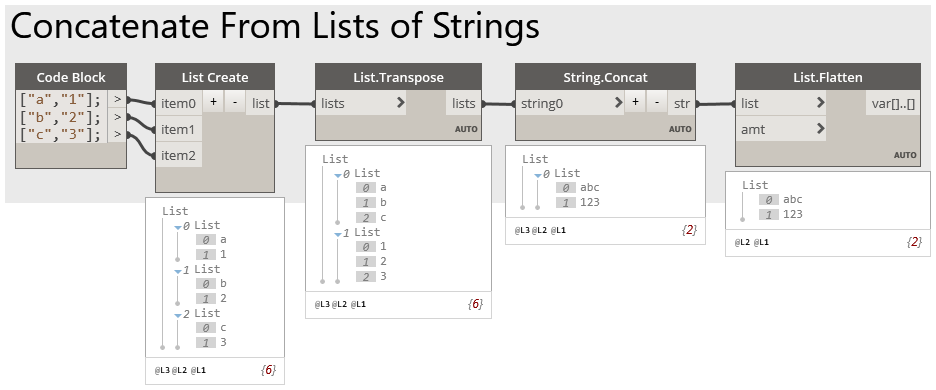
As you can see, the result is a list of strings, one for each input, with the strings in each input concatenated together. I was expecting ["abc", "123"], but I got ["a1", "b2", "c3"]. This seems contrary to what it does when single strings are input - at least, it does to me. I found this quite frustrating, and on at least one occasion, wrote a quick Python Script node to do the concatenation the way I wanted it. But that quick Python Script did not allow for varying numbers of input lists of strings (I suppose it could be written to do so, but that would no longer be "quick"). I could not understand why the String.Concat node would not do what I wanted, and could not believe that the way it works is what most users would want, most of the time.

Once I set aside my frustration and started thinking again, it dawned on me that all I needed to do was rearrange my input data to work with the way the String.Concat works, and while that requires a few extra nodes, it is fairly easy to do. (Click on the image below to see it full-size.)
By using the List Create node, I combined my individual lists into one list of lists. The List.Transpose node then transforms that list of lists into another list of lists, in which each sublist has a list of the items from the same index in the original sublists. So each sublist has a list of the strings I want combined into one string, and this can be fed into the String.Concat node to get the desired concatenation. The output of the String.Concat node ends up having the list of concatenated strings nested in a list, so adding a List.Flatten node using the default flatten amount (totally flatten) results in a list of the concatenated strings, which was my desired result.

April 11, 2019

Dynamo: Python Node to Test For Presence of a Parameter on an Object

We have a Dynamo graph that allows the user to search for a user-specified string in the names of Views and, if found, replace it with a second user-specified string. This comes in handy when someone decides that all of the instances of "LEVEL" in the view names should be changed to "FLOOR". The graph worked, but would result in an error condition, because there are, apparently, Views that do not have a "View Name" parameter attached to them. Attempting to retrieve the View Name parameter value from all elements of the Views category using an Element.GetParameterValueByName node resulted in this error:

While this did not appear to interrupt the processing of all Views, I would prefer to not have an error reporting (in both Dynamo and Dynamo Player), so that I do not have to explain to others who might use the graph that having that error is "Ok". I thought it would be simple to construct a BoolMask to filter out the Views without a View Name parameter, and proceeded to try to do so. Perhaps there is an easy way to create that BoolMask with core nodes or with something from a package, but my initial attempts were unsuccessful. The best I could do was get a list with true for the Views with the parameter but null for the Views without it, while throwing additional errors; that result also did not work as a mask in the List.FilterByBoolMask node. I quickly ran out of patience and decided to generate the mask list using a Python node, which turned out to be fairly easy.

Each Element in the Revit Model has a ParametersMap attribute, which is a map that contains all of the parameters the Element contains, accessible via the parameter Name, using the Contains(key) method for the ParameterMap object, where the key is the name of the parameter of interest. The potential for an error condition for Views without a View Name parameter can be handled by using try: and except: statements to build the mask list, as shown in the image below.

The Python node has two inputs, the first, IN[0], a list of Elements to be tested for the presence of a particular parameter, and the second, IN[1], a string representing the name of the parameter. The Contains method will return True if the Element's ParametersMap contains a parameter whose name matches the string passed to the Python node in IN[1]. If there is not a matching parameter name, it should return False; in testing, some of the Views were throwing an error, in which case the except: statement adds False to the output list.

The output from this Python node worked to remove the Views without a View Name parameter from the list of all elements of the Views category, allowing the rest of the graph to do the renaming of the Views without any error messages.

January 12, 2019

Dynamo: Getting a List of All Label Types

We have a client with specific font standards in AutoCAD® that I suspect will carry over into Revit®. These differ from our office standards, so I was looking for a way to more easily change the fonts used for various text entities in a project file started with our template file or loadable families, and hoping to use Dynamo as part of the solution.

In a project file, getting all of the TextNoteTypes (for Text) is fairly straightforward. Start with an Element Types node set to "TextNoteType" and feed it to an All Elements of Type node. In a family file where Labels are present, getting a list of TextElementTypes is a little more complicated, if you do not want them mixed in with TextNoteTypes, as setting the Element Types node to "TextElementType" and feeding the output to an All Elements of Type node will return both types. A List.FilterByBoolMask node can be used to separate the two types, if your application needs to operate on just one or the other type (or both, but separately). The image below illustrates one possible arrangement, where the in ouput will have a list of the TextElementTypes (Labels) will and the out output will have a list of the TextNoteTypes (Text).
The List.FilterByBoolMask node in the green area is the node with the separated lists. The other List.FilterByBoolMask node in the upper right is there just to show the Family Name parameter value of each Type, to verify that the mask worked as desired, and can be deleted.

December 09, 2018

Dynamo: Export Views and Sheets from Revit - Part 6

First post in this series [Part 1]
Previous post in this series [Part 5]

We now have all of the user input needed to create the export, and we have taken the user-specified ViewSheetSet and generated a list of the View and Sheet objects included in the ViewSheetSet and a corresponding list of names to be used for the exported Views and Sheets. All that remains is to do the actual export. The Python Script 2 node in the Export to DWG group does the export.
There are six inputs to this node:
  • IN[0]: This input takes the folder the user specified as the destination for the exported drawing files (see Part 1).
  • IN[1]: The recombined list of Views and Sheets is sent to this input (see Parts 2 and 3).
  • IN[2]: This input receives the list of generated file names for the exported Views and Sheets (see Part 4).
  • IN[3]: The name of the DWG Export Setup to be used is sent to this input (see Part 5).
  • IN[4]: The user choice of whether to merge the Views on a Sheet into one drawing file (true) or not (false) is received by this input (see Part 5).
  • IN[5]: The user choice of whether to actually export the Views/Sheets (true) or to just run the graph without exporting (false) is sent to this input (see Part 5).

The image below shows the Python code that processes this input. The majority of this code was written by Konrad K Sobon, and posted to this thread in the DynamoBIM forum. It also includes the ability to have exported Sheets to have the Views on the Sheet merged into the View drawing file, rather than exported as separate drawing files that are then externally referenced by the Sheet drawing file. This addition was posted to the DynamoBIM forum by 4bimfercesp in this thread. The ability to specify the name of an existing DWG Export Setup comes from code posted by Andrea_Ghensi in the same thread in which Mr. Sobon posted his code. As I read through the postings and assembled the code shown below, I added some additional comments to solidify my understanding of what the code is doing.

If there are no errors generated in the course of performing the requested export, the Python Script 2 node outputs a string, Success!. This is displayed in the Watch node to the right of the Python Script 2 node. If there is at least one error, then the error report is the output, and is displayed in Watch node to aid in sorting out what went wrong. If the user input in the Group 5 area is false, indicating that the export is not to be done, then the output is a reminder to set the Ready to Export Views and/or Sheets - Boolean node to true to perform an export.

If you need to export the same Views and/or Sheets multiple times as a project makes its way through the design and documentation process, this graph can be a time saver while improving consistency. Customize a copy of it for each project, and use Dynamo Player to be a few clicks away from a new set of export files at any given moment.

November 29, 2018

Dynamo: Export Views and Sheets from Revit - Part 5

First post in this Series [Part 1]
Previous post in this series [Part 4]

So far in this series, we have seen nodes that allow the user to specify a folder to receive exported drawing files, a node for the user to enter the name of a ViewSheetSet which lists the Views/Sheets to be exported, the nodes that generate a list of Views/Sheets that are in that Set, nodes to separate that list into separate lists of just Views and just Sheets, and the nodes that generate file names to be used for the exported Views and Sheets. This post will examine the balance of the user input nodes.


Each of these three input nodes includes a second "Passthrough Value" node, which are renamed Code Blocks and, as the node title suggests, simply pass through the value from the input node. They are not at all necessary, and are only there to make the group each is in wider, so that the rather long group titles will only take up two lines of text.

The Name of DWG Export Setup - String node (Group 3) is a String node into which the user enters the name of the DWG Export Setup to be used for the exports. This can be left blank if the user wants to use Revit Default settings.

The Merge Views on Sheet into one DWG File? - Boolean node (Group 4) is a Boolean node that allows the user to choose whether Views on a Sheet should be exported as one DWG file (True) or if the Views should be exported as separate DWG files that are externally referenced into the exported Sheet (False).

The Ready to Export Views and/or Sheets - Boolean node (Group 5) is a Boolean node. Setting this to False allows the user to enter data in the other nodes and Run the graph to view the results in the Watch nodes, verifying that all is correct before actually exporting any files. When all is ready to go, set this to True and run the graph one more time to export the Views/Sheets.

All three of these input nodes, like the other two, are set to be input nodes (see first post), so that they are available if this graph is run via Dynamo Player. The next and final post will examine the Python Script 2 node and the code inside it, that does the actual exporting.

Next post in this series [Part 6]

October 15, 2018

Dynamo: Export Views and Sheets from Revit - Part 4

First post in this series [Part 1]
Previous post in this series [Part 3]

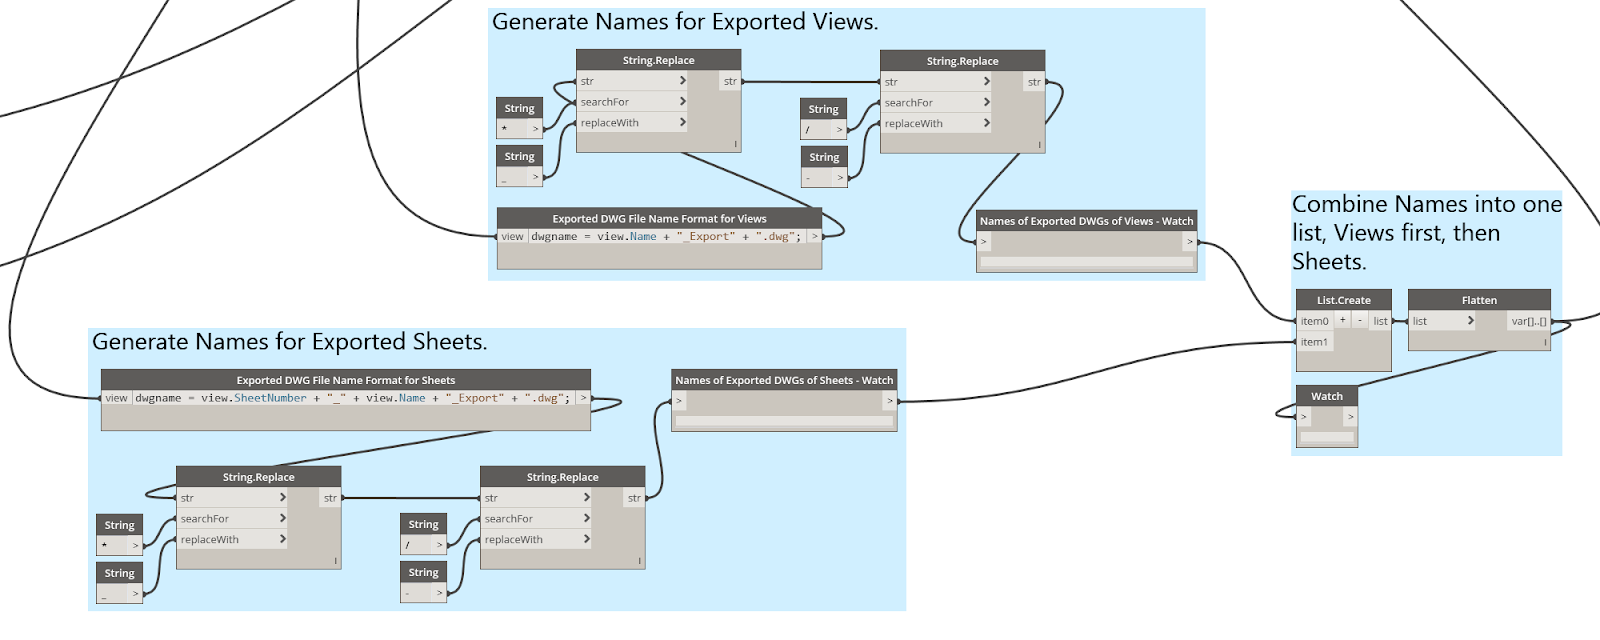
This post describes the nodes that generate the file names for the exported drawing files. As you may recall from the previous posts in this series, a list of Views and Sheets was generated from a user-created ViewSheetSet in Revit® by a Python Script node. That list was then separated into two lists, one for Views and one for Sheets, to allow for separate naming conventions for the exported drawing files for each. (Specifically, so that the sheet number can be included in the file name for Sheets.) The nodes that do this are contained in three groups: Generate Names for Exported Views, Generate Names for Exported Sheets and Combine Names....
All three groups make use of out-of-the-box nodes. The first two groups are nearly identical, and can be described simultaneously. The first node in each of those groups is a Code Block node, renamed to Exported DWG File Name Format for Views for the exported Views and Exported DWG File Name Format for Sheets for the exported Sheets. Each of these nodes has one input, view which takes the respective list from the List.FilterByBoolMask node covered in Part 3. A combination of parameter values associated with each View/Sheet and text is used to create the file name for each View/Sheet:
  • For Views: dwgname = view.Name + "_Export" + ".dwg";
  • For Sheets: dwgname = view.SheetNumber + "_" + view.Name + "_Export" + ".dwg";
The drawing name for Views concatenates the view.Name parameter value with "_Export" and the ".dwg" file extension. The drawing name for Sheets is similar, but adds the view.SheetNumber parameter values at the beginning, separating the sheet number from the sheet name with an underscore ("_") character. This is what I set up as a default for use in my office; you can customize this to meet your needs by adding, removing or rearranging the parts.

The lists of Sheet and View names are then run through two String.Replace nodes. The first replaces any asterisks ("*") with underscores ("_") and the second replaces any forward slashes ("/") with hyphens ("-"), as neither of these characters are permitted in a drawing file name, even though they are allowed in a View or Sheet name in Revit. Each resulting list of file names is then passed through a Watch node, so that the contents can be inspected after the graph is run. These two lists are then sent to the Combine Name... group, where a List.Create node and a Flatten node combine them into a single list. An optional Watch node is included here, as well.

So now we have a combined list of View and Sheet objects (from Part 3) and a combined list of file names for the corresponding exported files. The next post will look at the remaining user input nodes.

Next post in this series [Part 5]

September 12, 2018

Dynamo: Sorting a List of Lists by a Value in the Sub-List in Python

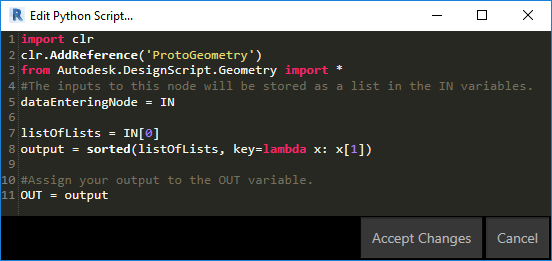
I had a list that was composed of sub-lists, each sublist contained a Sheet Object and the values of three parameters associated with that Sheet, including the Sheet Number. I wanted to be able to sort the sub-lists in ascending order of the Sheet Number value in each sublist. I found the following Python code does the job:
sortedLists = sorted(listOfLists, key=lambda x: x[index])
where index is the index of the item in the sub-list on which you want to do the sorting.

For example, given a list with four sublists, similar to that in the image below,
where the index of the Sheet Number in each list is 1, the code below
will sort the sub-lists by the item in index 1 of each sub-list, with a result of

This page on the stackoverflow website helped me work this out. Two additional notes:
  • If you want to replace the original list with the sorted list, you can use this syntax:

    listOfLists.sort(key=lambda x: x[index]).

  • If you want to sort in descending order, add reverse=true as a parameter:

    sortedLists = sorted(listOfLists, key=lambda x: x[index], reverse = true)

    or

    listOfLists.sort(key=lambda x: x[index], reverse = true).

September 01, 2018

Dynamo: Export Views and Sheets from Revit - Part 3

First post in this series [Part 1]
Previous post in this series [Part 2]

This post describes the nodes used to separate the Views from the Sheets that were obtained from the ViewSheetSet that the user specified as the source of Views and/or Sheets to be exported. This Dyanmo graph generates file names for the exported Views/Sheets. In order to be able to use the Sheet Number in the file name of exported Sheets, Views and Sheets need to be processed separately when generating the file names as Views do not have a Sheet Number parameter, so that cannot be part of the name generation code for Views. Separating the Views from the Sheets in two separate lists and processing each list separately when generating the file name seemed like the easiest way to handle that.

As noted in Part 2, the Python Script 1 node generates a list of View and Sheet objects, based on those included in the ViewSheetSet specified by the user. In order to separate that list into two separate lists, the List.FilterByBoolMask node is used. That requires a Boolean Mask, which is a list of true and false values. Items in the original list whose index corresponds to a true in the Mask list end up in the "in" output list. Those that correspond to false become part of the "out" list. The nodes in the lower left corner of the image above generate the Boolean Mask:
  • The list of Views/Sheets in the Set are fed into the "element" input of a Element.GetParameterValueByName node.
  • A String node provides the input to the "parameterName" input, with a value of "Category".
  • This creates a list of category objects, representing the category of the items in the View/Sheet list.
  • That list of categories is converted to a list of strings, representing the name of each category by the Element.Name node.
  • This list of strings is then passed to the Equal x to y? operator node (==), as the "x" input.
  • The "y" input is provided by a String node, with the value "Views".
  • The output will be a list of true/false values, based on whether the category name is "Views". Any Views on the original list will have a true value, and any Sheets will have a false value on that list.
Feeding the original list of Views/Sheets into the "list" input of the List.FilterByBoolMask node and the Bool Mask we just created above into the "mask" node will send the Views to the "in" output and the Sheets to the "out" output. These are sent to the respective file name generation nodes, to be covered in the next post in this series.

But before closing, there are two additional nodes in the blue node group in the image above. Eventually, we need to export the Views and/or Sheets, so we need to recombine the separated lists. I chose to put the Views first and the Sheets second, and used a List.Create node to combine the two. The List Create node will generate a list with two sublists, one of the Views and one of the Sheets. I just want a single combined list, which the Flatten node creates.

Note also that it is perfectly acceptable for the ViewSheetSet to have only Views or only Sheets. The nodes above will still generate two separate lists; one will just be empty.

Next post in this series [Part 4]

August 10, 2018

Dynamo: Export Views and Sheets from Revit - Part 2

First post in this series [Part 1]

This post will cover the part of the graph that gets the list of Views and/or Sheets from a user-selected ViewSheetSet that are to be exported.
As noted in Part 1, the user has to create a View/Sheet Set in Revit® and add all of Views and/or Sheets to be exported to that set. The user enters the name of that set into a string node, labeled ViewSheetSet Name - String in the green-colored group labeled 2. Enter Name of Set to Export. Just above that, the Element Types node is set to the ViewSheetSet type, which is then fed to the All Elements of Type node to get a list of all of the ViewSheetSet objects in the active project. This list of ViewSheetSet objects is passed to the Element.Name node, which generates a list of the names (as strings) of those ViewSheetSets. This list is passed to the IndexOf node, along with the name that the user entered, to determine the index of that name on the list. Finally, the list of ViewSheetSets and the index of the desired ViewSheetSet are passed to the List.GetItemAtIndex node, to get that ViewSheetSet object.

During my initial testing, I passed the ViewSheetSet object to an Element.Parameters node, to see what information could be obtained from the object. The list of Views/Sheets included in that ViewSheetSet was not found there, so this node need not be included in the final graph. It turns out that there is not a node that ships with Dynamo that will generate a list of Views/Sheets that are included in a ViewSheet Set, and I was not able to find one in any of the third-party packages I have installed. I was able to find this thread in the DynamoBim.com Forum, in which Kulkul posted the Python code needed to extract a list of the Sheets/Views. My adaption of that, shown in the image below, is the code behind the Python Script 1 node, which takes the desired ViewSheetSet object as input and generates a list of the included Views and Sheets as output.

That list of Views and Sheets is then sent to several locations. During development, I added an Element.Name node and two Watch nodes to view the list. These do not need to be part of the final graph, but I left them in as a way to visually check that the correct ViewSheetSet was obtained.

In the next installment, I will cover the nodes that separate the list of Views/Sheets into separate lists of Views and Sheets. I wanted to do this so that I could include the Sheet Number value as part of the name of exported Sheets. Since Views do not have a Sheet Number property, they needed have the name of the exported drawing generated separately.

Next post in this series [Part 3]

July 10, 2018

Dynamo: Export Views and Sheets from Revit - Part 1

I had a request the other day to streamline the process of updating CAD Exports for an Autodesk Revit® project. Unfortunately, some team members are not working in Revit, so certain Views have to be exported to CAD on a regular basis for use as backgrounds for the non-Revit-using team members. After a bit of trial (and a little tribulation) along with an enormous amount of help from the generous souls who have posted sample code to the Community Forums at dynamobim.org, I came up with the following Dynamo graph. All of the nodes used are "out-of-the-box" nodes available in the 1.3.2 version of Dynamo, but there are two Python Script nodes, the code for which is based on example code posted in the Community Forums. (As always, click on a image to see a full-size version of the image.)

The end user has to do three things prior to using the graph:
  • Create a View/Sheet Set into which all of the Views and/or Sheets to be exported are placed.
  • Get the name of the DWG Export Setup to be used for the export. (Create a new one if required by the project.)
  • Identify the folder (with full path) where the exports are to be sent.
With that information in hand, the user can make a project-specific copy of the Dynamo file, enter those three items in the appropriate nodes, save the file, and then run it whenever updated exports are needed. Dynamo will overwrite any files of the same name in the target folder, so previous versions need to be archived elsewhere if a record of all exports is required. In the next few posts, I will go through the various sections of the graph, and, to the best of my ability, explain how each works, including the two Python Script nodes that do the heavy lifting. Before doing so, I would like to thank the following Community Forum contributors whose helpful responses to others' questions also helped me to complete this project.
  • Konrad K Sobon, for the code in the Python Script 2 node that does the exporting, as well as for the advice given to Andrea_Ghensi in the same thread regarding code to have a specific DWG Export Setup used for the export. See the full thread here.
  • Andrea_Ghensi, for the code in the Python Script 2 node that allows the user to specify an existing DWG Export Setup for the export (as amended by Konran K Sobon). See the same thread as the previous link.
  • 4bimfercesp, for the line in the code in the Python Script 2 node that allows the user to specify whether Views on a Sheet should be merged into the exported sheet or exported as a separate file that is externally referenced into the exported Sheet file. See the full thread here.
  • Kukul, for the code in the Python Script 1 node that extracts a list of the Views/Sheets in a View/Sheet Set. See the full thread here.
The nodes at the left side of the graph that are in green-colored groups are the nodes that require user input. I will conclude this first post with one of the simpler parts of the graph, the Folder for Exported DWGs - Directory Path node.
This is an instance of the out-of-the-box Directory Path node, with a modified node title. The Browse button allows the user to navigate to the folder where the exported drawings are to be placed. The output of this node is fed to the IN[0] input of the Python Script 2 node. One thing to note about this node, and the other user input nodes, is that if you right click on the node, you will see that the Is Input item on the context menu is checked. That means that this node will be available for user input in Dyanmo Player.

I am not certain how many clicks using this graph will save over manually doing the same export (probably a few on subsequent exports if Dynamo Player is used, without making any changes to the inputs), but it certainly will help make the process more consistent.

Next post in this series [Part 2]

December 27, 2017

Dynamo: Forcing Exactly One-Half to Round Up

In the same Dynamo graph on which my previous post was based, I had a need to round a real number to the nearest whole number, and I wanted a decimal of exactly .5 to round up. The Math.Round node met all my rounding needs except for when the decimal value is exactly 0.5; that node "rounds to even," which means that both 1.5 and 2.5 will round to 2, since 2 is even. Statistically, when dealing with a large amount of data, always rounding exactly 0.5 to even (or rounding always to odd) makes sense, as always rounding up would tend to skew any mathematical analysis of the data to a higher value. In this case, the number was being used only as a label, and I decided that it should always round up.

I put together the following nodes to achieve the desired results. Numbers in the explanation below refer to the numbers in the image. As always, you can click on the image to see the full-size version.

  1. This code block provides the source number to be processed.
  2. The nodes in Area 2 divide the source number by 100. In the example in the image, this results in a value of 12.5. This value is fed to the nodes in Areas 3, 4 and 5.
  3. The Math.Floor node truncates any fractional part in the value from Area 2, resulting in an integer of 12 in the example. This value is fed to the nodes in Areas 5 and 6.
  4. The Math.Round node takes the value from Area 2 and rounds it. For the example value of 12.5, the .5 is rounded to even, or 12. The result is a floating point number. This value is fed to a node in Area 7.
  5. The nodes in Area 5 take the value from Area 2 (12.5 in the example) and Area 3 (12 in the example) and subtract the Area 3 value from the Area 2 value. The result of the subtraction (0.5 in the example) is compared to the value in the Code Block, which is 0.5, by the == node. If the two are equal, the result of the comparison is true, as it is in the example; otherwise, it is false. This result is fed to the test input of the If node in Area 8.
  6. The Area 6 nodes take the integer result from Area 3 and add the value in the Code Block, or 1.0, to it. This is the rounded up value; it is 13 in the example.
  7. The two Math.Floor nodes in Area 7 take the real number results from Areas 4 and 7 and convert them to integers. These values were already whole numbers, but the Math.Round and + nodes output is a floating point number, not an integer. The application for which this rounding is being done required an integer. If it does not matter to your application whether the rounded number is a floating point number or an integer, these nodes would not be required. In hindsight, it occurs to me that one Math.Floor node could have been placed after the If node.
  8. The If node in Area 8 determines whether to use the result of the nodes in Areas 4 - 7 or Areas 3 - 6 - 7, based on whether Area 5 evalutes to true or false. If true, then the fractional part was exactly 0.5, and the rounded up value from Areas 3 - 6 - 7 is used. Otherwise, the rounded value from Areas 4 - 7 is used. This value will be rounded up for fractional values greater than 0.5 and down for fractional values less than 0.5.

June 30, 2017

Dynamo: Rounding Up

I was looking to try to automate some life-safety-related tasks in Revit® today, specifically related to occupant load calculations, and set out to create a Dynamo graph. I wanted to be able to round up the Area parameter value derived from an Area object, so that a whole number would be used (matching the calculated value in a Schedule) and I also wanted to round up any "fraction of a person" that results from dividing the Area value by the area per occupant value (as specified in the governing building code). I did not see a "Round Up" node in the standard Dynamo nodes, just two different Round nodes, one to round to the nearest whole number and one where you can specify the number of decimal places in the rounded number. (I am currently using the 1.2 release - yes, I know I am behind.) So I set out to create my own Round Up node. NOTE: As my interest here is with positive numbers and rounding up to the next largest whole number for values that are not already a whole number, I did not worry about how negative numbers should be treated (should they round toward or away from zero?). If your application does involve negative numbers, you will need to determine which direction they should round, and adjust the node definition accordingly.

The image above shows the definition of the Round Up node that I created. (As always, you can select an image to see the full-size version.) The math behind it is fairly straightforward:
  • The Input node takes a number as input.
  • The Math.Floor node takes the input number and truncates any fractional part.
  • The x subtract y. node subtracts the result of the Math.Floor node from the original number, to determine the fractional value (if any).
  • The x less y? node compares that fractional value to zero, generating a value of true if it is greater than zero, or false if not.
  • The If node uses that true/false value as the test input, and passes along a value of 1 if the test value is true or 0 if the test value is false.
  • Finally, the Adds x to y. node adds the truncated result of the Math.Floor node to the value of the If node, and passes this along to the Output node as the result of this custom node.

So, if there is a fractional amount, one is added to the whole number portion of the input value; otherwise, zero is added to the whole number portion, which is "rounding up".

While testing this as part of my Dynamo graph, I noticed that one of the Area values, which was reporting as 100 square feet in Revit (after using the RoundUp function in Revit) was unexpectedly rounding up to 101. I took a look at the node values and discovered that an Area that was inside boundaries that formed a 10'-0" square was reporting an area of 100.000000000002 square feet inside Dynamo. While I always want to round any true fractional value up, I decided that it was unreasonable to assign two occupants to that 100 square foot Office (at 100 square feet per occupant) for a non-zero value in the twelfth decimal place. In my mind, that is a computational error. So I came up with another custom node, called Round Up with Floor (see image below).
This custom node definition has all of the same nodes as the Round Up node, except the Code Block that supplies the zero value to the x less y? node is replaced with a second Input node. That allows you to specify the value above which the rounding up will occur. I still need to do additional testing to determine at what value the RoundUp function in Revit will actually round up. For my first test of the Round Up with Floor node, I used a floor value of 0.000001 (one millionth of a square foot), and that eliminated the rounding up of the one area with the very small fractional amount.

August 14, 2016

Dynamo - Element Parameters

If you are relatively new to Dynamo and not intimately familiar with the Revit API, like me, you may find this relatively simple graph of use.
The Select Model Element node at the upper left allows you to select an element in your Revit model and will report back, through the two Watch nodes at the right, the available instance parameters and their current values. These are the parameters that work with the Element.GetParameterValueByName and Element.SetParameterValueByName nodes. This can be helpful in identifying the parameter you need to access for a particular task.

The Element.Parameters node generates a list of these parameters, the Element.Name node takes that list and turns it into a list of the parameter names, as strings, and the List.Sort node sorts that list alphbetically. The left Watch node displays this sorted list; the list is also fed into the Element.GetParameterValueByName node, which generates a list the values for those parameters, for the selected element, and displays them in the right Watch node. My experience has been that the Element.Parameters node will list the parameters found in what seems like a random order that makes it hard (for me, anyway) to track them from element to element. The description of the Object.Identity node states that it passes out what is passed into it, doing nothing, which, I suppose, it true, but I included it here because by locking the Data Preview of the node in the open position, it shows the element category as well as the element ID number, whereas the Select Model Element node only shows the element ID number. Seeing the element category helps me be sure that I selected the desired element correctly.

Here are two screen shots of this graph in action, one with a Wall selected, and the other with a Dimension selected.
As always, you can select any of the images to see it full size.

May 30, 2016

Dynamo - Filter by Type Parameter

I created another custom node for my fire/smoke rating Detail Item placement graph, previously discussed here and here. The previous two nodes gave me a list of all of the straight Walls visible in the current plan View, whose Base Constraint matched the level of the current View. In order to apply the correct Detail Item to each fire/smoke rated Wall, that list needs to be filtered, based on the fire-resistance-rating and whether the Wall is a smoke partition or smoke barrier. This information is stored in a type-based parameter for the Wall Types. I needed to repeat this multiple times in this graph, and since it also seemed to me that this was something that will have use in future projects, I created a custom node.

The custom node takes three inputs, one for the list of Elements (Walls) to be filtered, one for the name of the Parameter that is the basis for the filter and one for the value of the Parameter that will determine which Elements are "in" and which are "out".

The filtering is done in a similar way that the straight Walls were filtered, except this time, instead of using the fact that an empty string would be returned as the value for an instance-based parameter that was not present on the straight Walls, the Element Type of each Wall needs to be retrieved, using an Element.Type node, and then the value of the filtering parameter obtained from that by an Element.GetParameterValueByName node. An == (x equal to y) node is again used to generate a Boolean Mask list of trues and falses.

The Boolean Mask list is then used in a List.FilterByBoolMask to put the Elements that match the parameter in the "in" output and those that do not in the "out" output.

The entire graph of the custom node is shown below.

May 26, 2016

Dynamo - Filter Straight Walls

As part of the Dynamo project for which I developed the Active View Walls at Plan View Level custom node, I also needed to be able to operate on straight Walls and radiused Walls separately. I ended up making a custom node to handle this, to both make the main graph easier to read and so that I could easily reuse the "code" should I need to do this in a different graph in the future.

The graph of the custom node is fairly straightforward, as you can see in the image below. (Click on any reduced-size image to see the image full size.)
A brief description of the various parts and what they do follows.

While my current application passes this node a list of Walls, I decided that may not always be the case in future graphs, so the first set of nodes uses a RemoveIfNot node to strip out any element in the list that is not a Wall.


While poking around in the properties that were available on the Walls in my test project, I noticed that radiused Walls have a parameter called Center Mark Visible, while straight Walls do not. When getting the parameter value for Center Mark Visible, straight Walls will have an empty string value, while radiused Walls will have a value of 0 (center mark not visible) or 1 (center mark visible). I chose to use this as the way to determine if a Wall was straight or radiused. The next set of nodes generates a list of Booleans (true or false) that parallels the list of Walls. The corresponding Boolean will be true if the Center Mark Visible parameter value for the Wall is an empty string (straight Wall) or false if the value is not an empty string (radiused Wall).


The list of Booleans generated by the previous set of nodes is used as a "Boolean mask" by a List.FilterByBoolMask node and applied to the list of Walls to generate two separate lists. The "in" list contains all of the Walls with a corresponding Boolean of true, or all of the straight Walls. The "out" list contains all of the Walls with a corresponding Boolean of false, or all of the radiused Walls.


The in and out lists are connected to the Straight and Curved outputs of the custom node, so that the main graph has access to the two filtered lists. This custom node was developed in Dynamo 0.8.2, but has been successfully used in the 0.9.1 and 1.0.0 versions as well.