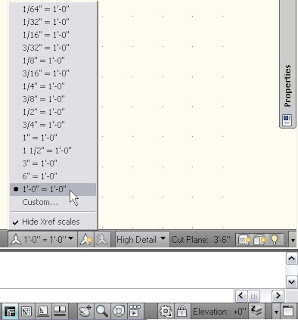
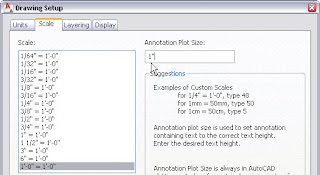
Step 1: Set the Drawing Scale to 1’-0” = 1’=0” (or 1:1, for metric users) and the Annotation Plot Size to 1. In 2008, you can do both on the Scale tab of the Drawing Setup dialog. In 2009, you will need to set the Scale in the popup list on the Drawing Window Status Bar (or on the Application Status Bar, if you have the Drawing Window Status Bar turned off), since the Scale list on the Scale tab is only used to associate a Display Configuration with a scale, not to set the Drawing Scale.


Step 2: Create the graphics for your view block(s), keeping in mind that one unit in the block will plot at the Annotation Plot Size in effect at plot time. So if you want the property datum displayed in a particular attribute to plot at the Annotation Plot Size, make the attribute definition or text placeholder (if you are using the Define Schedule Tag wizard) one unit high. You can scale attribute definitions/text place holders up or down from one unit to get larger or smaller text in the tag, if desired. Draw any other graphics to suit. If you plan to start with the graphics from an existing Multi-View Block, you can insert an instance of it now, and it will be scaled in accordance with one unit plotting at the Annotation Plot Size, since the effective scale factor in 1 (Drawing Scale of 1 x Annotation Plot Size of 1). If you prefer to insert the view block of the tag directly, that too will insert at the proper size (Drawing Scale Factor of 1). Make the desired changes to the exploded content, or draw the desired graphics from scratch.
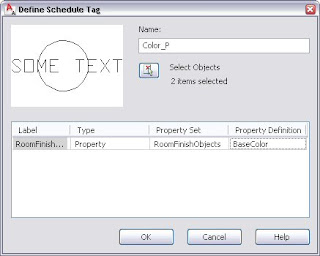
Step 3, Option A: Fire up the Define Schedule Tag wizard, select your graphics, convert any placeholder labels that are meant to display properties to have a Type of Property and assign the desired Property Set and Property to each. TIP: I like to to follow the out-of-the-box naming convention of using the Multi-View Block name with “_P” appended to it for the view block. The wizard will assign the same name to both the Multi-View Block for the Schedule Tag and the view block definition. I find it easier to use the view block name in the dialog, and then rename the Multi-View Block Definition in the Style Manager after it is created. Once you have everything set the way you want in the dialog
 select the OK button, specify an insertion point for the Multi-View Block/view block, save the file and make a Tag tool by dragging the Multi-View Block to an editable tool palette. (For shared content, save the file as a source file in a location accessible to all, or copy the new Multi-View Block Definition to such a file, and then make the Tag tool from that file.) Set a Layer Key and make certain all of the other Properties of the Tag tool are as you desire, and you should be good to go. Reset the Annotation Plot Size back to your office standard, and set an appropriate Drawing Scale, and try out your new tag. It should come in at the expected size, and react to changes in Drawing Scale or Annotation Plot Size as expected.
Step 3, Option B: To use this option, you need to have attribute definitions with properly formatted attribute tags for each Property you want the Schedule Tag to show. Create an AutoCAD block definition for each view block you are going to assign to your tag. Fire up the Style Manager, create a new Multi-View Block Definition and add the view block(s) to the appropriate Display Representation(s) and then indicate the view directions for which each is to be visible. Exit Style Manager and save the file, or use Style Manager to copy the Multi-View Block Definition to a central source file and apply the changes. Create a Tag tool on an editable tool palette, set a Layer Key and make certain all of the other Properties of the Tag tool are as you desire, reset your Annnotation Plot Size and Drawing Scale and give it a try.
For a “simple” one-view-block Schedule Tag (as at least 90% of your tags will be, now that annotative content eliminates the need for multiple view blocks for multiple scales), Option A in Step 3 would be the way to go. Option B, on the other hand, may be useful if, for example, you have a space tag that needs to show different things for different drawing types – perhaps it shows the room name and area for schematic plans, room name and number for contract document floor plans and room name, number and ceiling height in reflected ceiling plans. Depending upon your workflow, it may be easier to have one tag that can do all of that than to have three separate tags. Of course, you could start out with Option A to get the first view block and the Multi-View Block set up, then add additional view blocks and adjust the Display Representations each block uses in the Multi-View Block as required.