- Identify the property[ies] you wish to display in your tag, and the Property Set Definition[s] that contain that[those] property[ies], along with any other Property Sets that you would like to have your tag attach. Create any new Property Set Definitions and/or copy existing ones to the file in which you will create the tag. This can be any drawing file for learning/experimental purposes, but when you are creating “final” tags, you will want to either use the out-of-the-box Schedule Tables (Imperial).dwg or create a tag source file to hold your office’s custom tags. This file also serves as the central repository for Property Set Definitions and Schedule Table Styles, and needs to be accessible to all who will use the Tool palette tool you create for your tag.
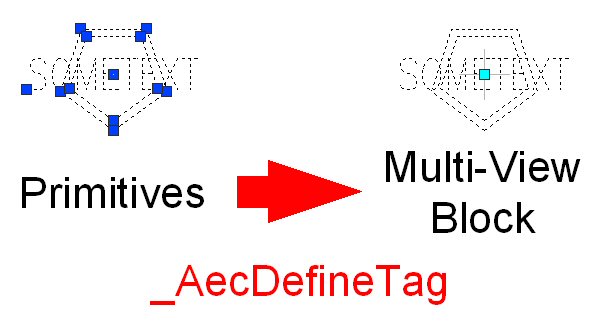
- In your source file, draw the graphics you want for the tag, using text placeholders where you want to display property data. Keep in mind that the tags will use annotation scaling, so make any placeholders you want to plot at the annotation plot size one unit high. Scale other placeholders and graphics accordingly. The string you use in your placeholder text will become the default text for the attribute definition the text will become, so choose your string with that in mind. Figure 1 below shows the primitive graphics on the left, a single piece of middle center justified text, one unit high, and two five-sided closed lwpolylines. The final tag is shown on the right. (Note: you can click on any of the pictures to see a larger, clearer version. Use the Back button on your browser to return to the post.)
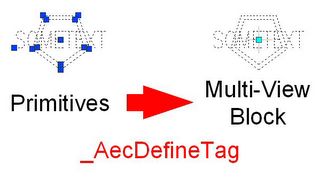
Figure 1: Primitive Graphics to Multi-View Block - Start the _AecDefineTag command; the easiest way is to choose Format > Define Schedule Tag… from the pulldown menus. Select your graphics, as directed by the command line prompt. The Define Schedule Tag dialog appears as shown in Figure 2.

Figure 2: The Define Schedule Tag dialog - The Define Schedule Tag dialog will show a preview image of your tag in the upper left corner. To the right of that, the Name edit box allows you to give your tag a name; the same name will be used for both the view block and the Multi-View Block for your tag. There is also a Select Objects button, to allow you to change the graphics to be included in your tag. Enter a name for your tag (see Figure 3).
- Below the preview graphics and the Select Objects button is a list box that shows each placeholder text item you included in your selection set. The Label column will initially show the text string of the placeholder text. If you leave a text item “as is”, it will be static text in the view block. To get your placeholder text to be converted to a properly formatted attribute definition in the view block, click where it says “Text” in the Type column on the row of a particular placeholder, and select Property in the dropdown list, as shown in Figure 3.

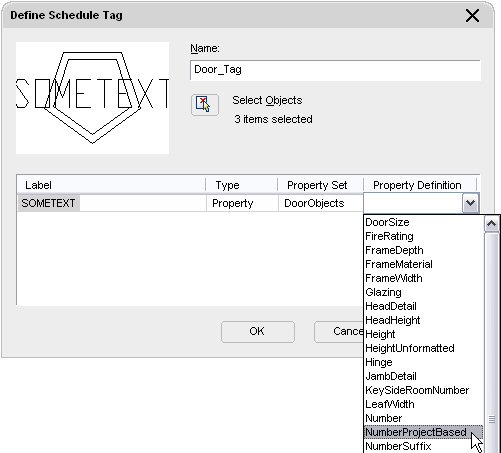
Figure 3: Entering a name and changing the Type to Property Move over to the Property Set column, and choose the Property Set that includes the property you want want this placeholder to display (Figure 4). Finally, choose the property name in the Property Definition column (Figure 5). Notice that the Label has now changed to the PropertySetName:PropertyName format that will be used for the attributed defintion tag, which will be familiar to those who have created tags in prior releases (Figure 6). Repeat this process for each placeholder text you included in your tag graphics.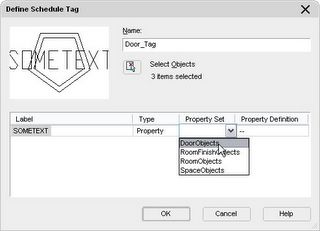
Figure 4: Selecting the Property Set
Figure 5: Setting the Property Definition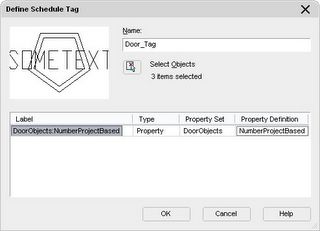
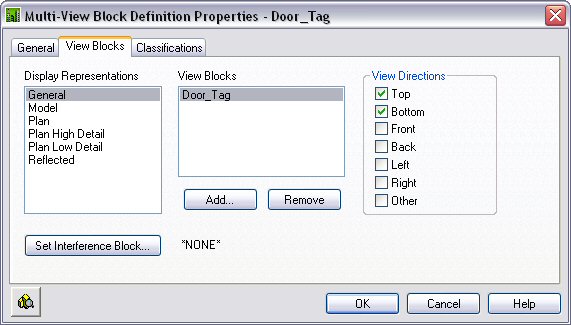
Figure 6: The Label is now formatted - When you are certain that all of the graphics are included and all of the placeholder text has been set to the correct property, select the OK in the Define Schedule Tag dialog and, following the Command line prompt, pick the point that will be the insertion point of your tag, relative to the selected graphics. The graphics are replaced with a Multi-View Block that contains a view block showing your graphics, and one or more attributes – one for each placeholder text that you converted to a property, see Figure 1 above. Save the file so that you can make a tool. Select the Multi-View Block, right click and choose Edit Multi-View Block Definition... from the context menu. Select the View Blocks tab and note that the view block created has been assigned to the top and bottom view directions for the General Display Representation for Multi-View Blocks, as indicated in Figure 7. Select the Cancel button to close the dialog without making any changes.
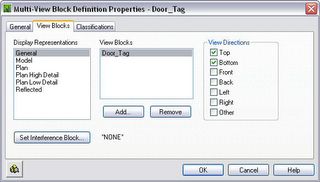
Figure 7: The View Blocks tab of the newly created Door_Tag MVB - Set an editable Tool palette current, then select the newly created Multi-View Block. Right-click and drag the Multi-View Block onto the tool palette. Edit the new tool’s properties, and set the layer key you want associated with the tool, and make any other settings. You are now ready to use your new tag. Figure 8 shows a door tagged with the example tag.

Figure 8: A tagged door
March 21, 2005
ADT 2006 Tags Illustrated
There was a glitch with the Hello BloggerBot yesterday that prevented me from including all the wonderful illustrations I had prepared for my previous post. Now that it has been cleared up, here is the tutorial, complete with illustrations.


Subscribe to:
Post Comments (Atom)
1 comment:
Good instructions, great new feature!!
Post a Comment